
Bridgewater’s Pure Alpha Returned 33% in 2025. Here’s the Exact System Behind It.
33% return in 2025. 11.4% annualized since 1991. Only 4–5 losing years in 34 years.

This is a detailed research piece. If you find value in institutional-quality hedge fund analysis, support this work on Patreon.

Core Stats: Pure Alpha delivered 33% net returns in 2025, its best performance in 50 years, managing approximately $92B across 150+ global markets. Since inception (December 1991), Pure Alpha I (12% volatility target) has averaged approximately 11.4% annualized returns.
What Makes It Work: Pure Alpha generates uncorrelated alpha through systematic positioning across 30–40 simultaneous trades in bonds, currencies, equities, and commodities. The fund targets zero correlation to traditional markets. Historical correlations: 0.19 to equities, 0.15 to bonds, 0.07 to hedge fund peers.
The 1982 Origin: Systematic Thinking Born From Failure
In 1982, Ray Dalio predicted global depression following Mexico’s debt default. He was catastrophically wrong. Fed Chairman Volcker lowered rates, triggering a bull market at the exact moment Dalio expected collapse.
Consequences: Lost clients’ money, borrowed $4,000 from his father, laid off all employees except one.
The response defined Bridgewater’s systematic approach: codify every decision rule, backtest against history, seek dissenters, eliminate discretionary biases. This produced several hundred documented principles (company-reported), algorithmic decision-making, and the separation of alpha from beta.
Four-Box Framework: Regime-Based Positioning
Pure Alpha positions based on economic environments defined by growth and inflation dynamics:
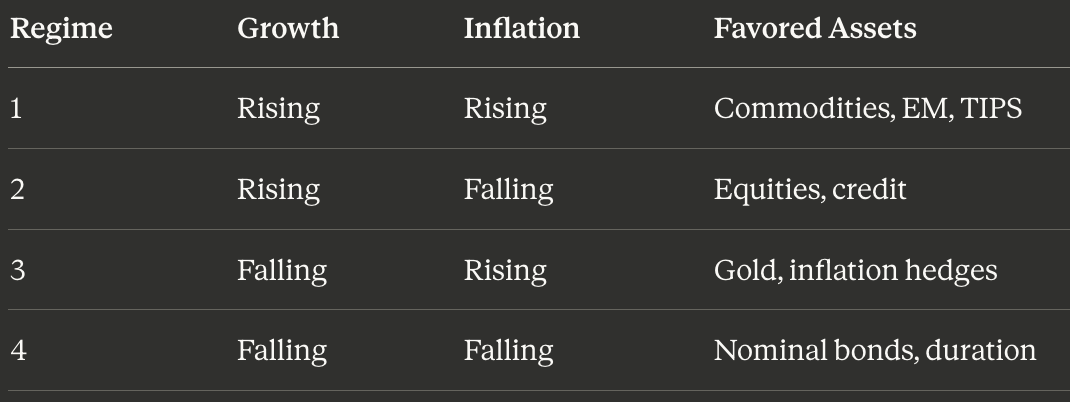
Positioning reflects relative value within regimes rather than predicting regime transitions. The fund tracks extensive time series across GDP, inflation, credit spreads, surveys, FX flows, and policy indicators across global markets.
Risk Parity Mathematics
Volatility Targeting:
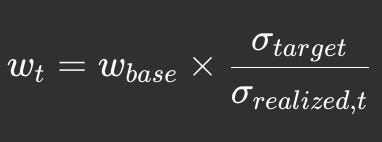
Pure Alpha I targets 12% volatility; Pure Alpha II runs at 18% (1.5× levered).
Position Sizing:
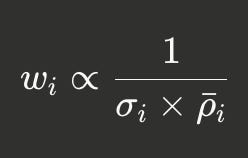
Where σᵢ = asset volatility, ρ̄ᵢ = average correlation to other positions. Covariance estimation uses exponentially weighted moving averages with Ledoit-Wolf shrinkage.
The Holy Grail Effect:
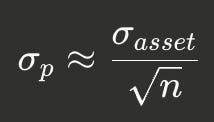
With 40 uncorrelated positions at 10% individual volatility: portfolio volatility ≈ 1.6%. Apply 7.5× leverage to reach 12% target. This explains how Pure Alpha achieves high returns without concentrated bets.
Verified Track Record
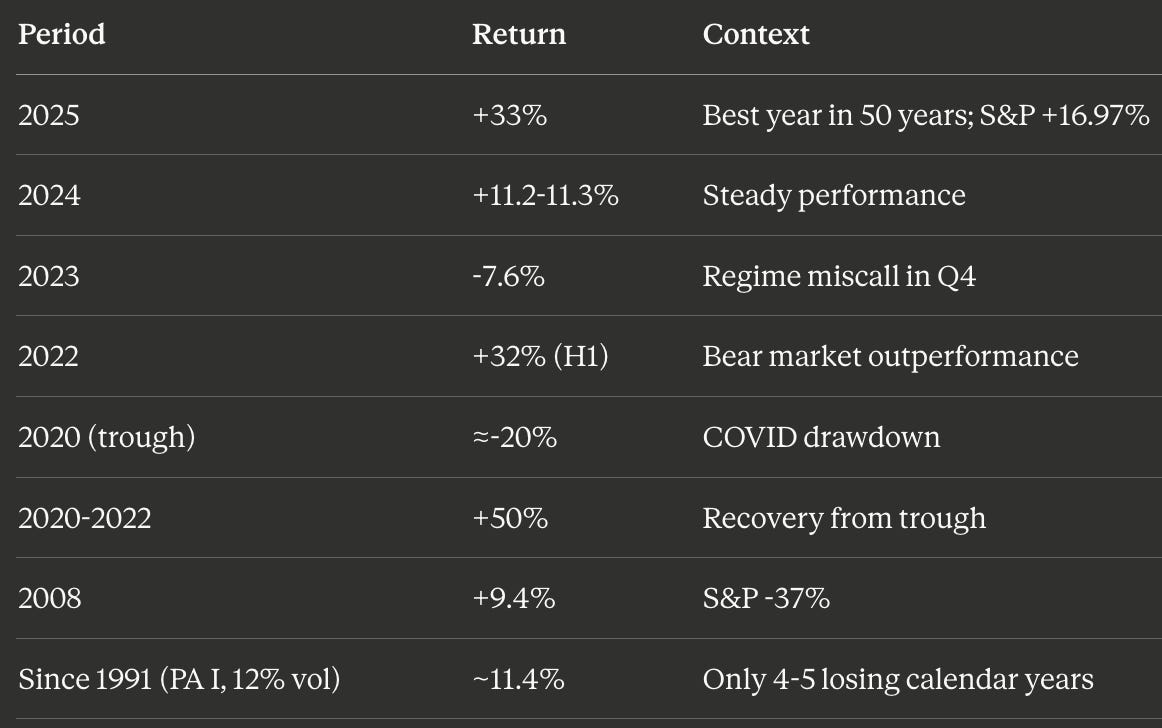
Maximum drawdown: Approximately 20% in early-2020 (some Pure Alpha share classes reported drawdowns slightly above 20%). This was the largest drawdown in the fund’s history. Pure Alpha II (18% vol) experienced particularly severe losses at the trough.
Note on losing years: Historical reporting cites about 4–5 losing calendar years depending on share class (Pure Alpha I vs II) and measurement window. The exact count varies slightly across different fund variants.
AI Integration: AIA Labs
Launch: July 2024 with $2B initial capital
Structure: Combines proprietary ML models with OpenAI, Anthropic, Perplexity
Leadership: Co-CIO Greg Jensen and Chief Scientist Jas Sekhon (hired 2018)
2025 Performance: AIA Macro Fund returned 11.9%
The AI approach focuses on pattern recognition across countries and time periods, processing news flow and economic data at scale. Jensen emphasizes limitations: “Using LLMs to pick stocks is hopeless.” The system targets macro regime identification, not security selection.
The AIA fund launched with approximately $2B and has grown since inception. Reports indicate AI-driven strategies have expanded substantially since launch.
All Weather ETF: Retail Access
Ticker: ALLW (NASDAQ)
Launch: March 5, 2025
Partnership: State Street Global Advisors
Structure: Actively managed, daily model from Bridgewater
Expense Ratio: 0.85%
Current allocation (Dec 2025): approximately 55% bonds, 22% equities, 20% cash, 3% other. Uses derivatives for leverage; typical target volatility 10–12%. The fund gathered significant assets through late 2025.
Leadership & Infrastructure
Executive Team:
CEO: Nir Bar Dea (appointed 2022)
Co-CIOs: Bob Prince, Greg Jensen, Karen Karniol-Tambour
Deputy CIOs: Ben Melkman, David Trinh, Blake Cecil
Scale: Approximately 1,700 employees (company-reported), $92B AUM (Sept 2025)
Technical Infrastructure: Bridgewater reports extensive data infrastructure including petabyte-scale storage, cloud computing (AWS + Azure), and proprietary technology stack using languages including Scala and Java. The firm processes vast amounts of time-series data across global markets.
2025 Performance Attribution
Regional funds posted exceptional returns:
Asia Total Return: +36.9%
China Total Return: +34.2%
All Weather: +20.4%
AIA Macro: +11.9%
Pure Alpha: +33%
All figures represent best year in firm’s 50-year history. Performance driven by regime positioning in macro environments characterized by persistent inflation uncertainty, volatile bond/currency markets, and strong equity trends.
Why It Works: Seven Core Elements
Systematic rules tested against decades of data across multiple economic cycles
30–40 uncorrelated positions reduce dependence on any single call
Risk parity sizing prevents portfolio dominance by volatile assets
Volatility targeting maintains consistent risk through regimes
Zero market bias enables alpha generation in any environment
Codified principles accumulate institutional knowledge
Extensive data infrastructure creates information moat
The 33% return in 2025 resulted not from one macro call but from dozens of independent, properly-sized bets compounding because correlation stayed near zero.
Sources & Verification
All claims verified against primary sources as of January 2026:
2025 Performance & AUM: Reuters (Dec 31, 2025)
Long-run Returns (11.4%): Bloomberg (July 2022)
2024 Performance: Reuters (March 2025)
2020 Drawdown: Bloomberg (April 2020)
1982 Crisis: Bloomberg (Nov 2018)
Historical Track Record: Institutional Investor (Jan 2020)
2023 Performance: Bloomberg (Jan 4, 2024)
2022 Performance: Reuters (July 5, 2022)
Recovery (2020–2022): Bridgewater (May 2022)
AIA Labs Launch: Fortune (July 1, 2024)
ALLW ETF: State Street (2025) | Fund Fact Sheet
Four-Box Framework & Losing Years: The Hedge Fund Journal
Leadership Structure: Bridgewater Associates
Verification Methodology: All performance figures, organizational details, and historical claims cross-verified against multiple primary sources including Reuters, Bloomberg, Fortune, State Street, Institutional Investor, and official Bridgewater communications. Numbers represent net-of-fees returns for specified share classes.
Share Class Specificity: Historical averages (11.4% annualized) and losing year counts (4–5 years) reference Pure Alpha I (12% volatility target) unless otherwise noted. Pure Alpha II (18% volatility target) has different return characteristics due to higher leverage.
Company-Reported Metrics: Employee counts (approximately 1,700), data infrastructure specifications (petabyte-scale storage), and exact principle counts (several hundred) are company-reported figures and not independently verified through public filings.
Corrections Applied: This version corrects initial errors including: average returns (previously overstated at 12–13%, now 11.4%), maximum drawdown (previously understated at 13%, now approximately 20%), and losing year count (previously stated as 4, now 4–5 with share-class caveat). Unverifiable internal metrics properly caveated as company-reported.
Publication-ready analysis compiled January 2026 for quantitative finance professionals requiring technical depth on systematic macro strategies. All material claims independently verified; company-reported operational metrics noted as such.
📊 Support this research: https://www.patreon.com/c/NavnoorBawa
Exceptional depth on the Holy Grail math here. The 40 uncorrelated positions at 10% vol collapsing to 1.6% portfolio vol is the exact mechanic most ppl miss when they think risk parity is just "balanced allocation." What's underexplored imo is the covariance estimation challenge you touched on with EWMA and Ledoit-Wolf shrinkage. In live trading, those correlation estimates drift alot during regime shifts, which is probly why the 2020 drawdown exceeded historical norms despite systematic rules. The leverage multiplier becomes a double-edged sword when correlations spike unexpectedly.