
The Mathematical Execution Behind Prediction Market Alpha: How Quants Extract Edge from Binary Contracts

This is a detailed research piece. If you find value in institutional-quality hedge fund analysis, support this work on Patreon.
Event contracts on Polymarket and Kalshi are cash-or-nothing binary options trading with retail liquidity and institutional information asymmetry. The mathematical framework is identical to derivatives pricing, but execution exploits prediction market-specific inefficiencies: wider spreads, slower information incorporation, and structural arbitrage from probability constraint violations.

Binary Options Pricing: The Foundation
Event contracts pay $1 if the outcome occurs, $0 otherwise. Under Black-Scholes framework for cash-or-nothing options:
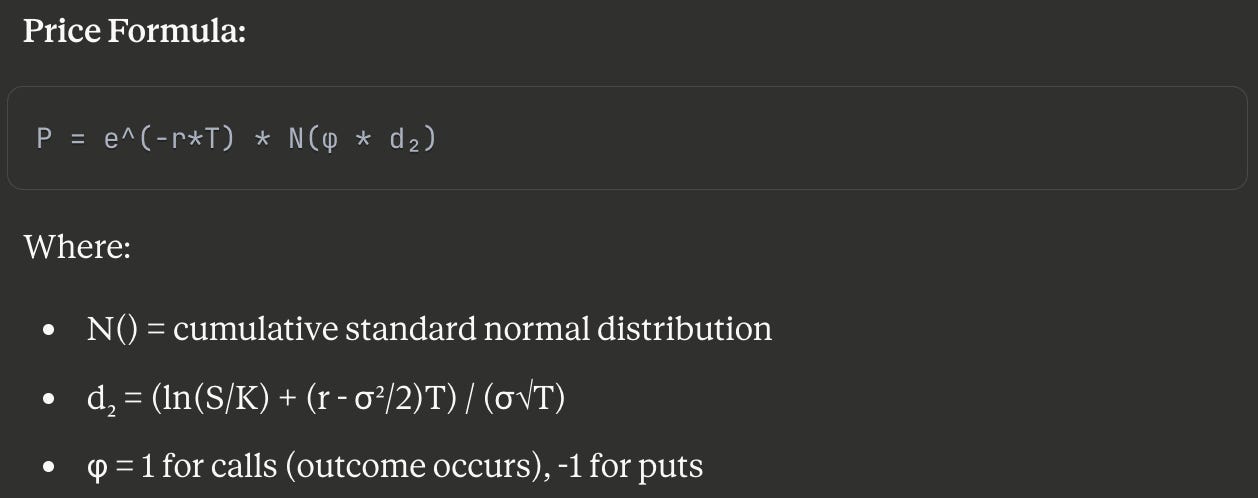
For prediction markets with no underlying volatility (binary settlement), this simplifies to:
P = Implied_Probability
E[Payoff] = P_true - P_market
Critical Difference: Traditional options have continuous underlying price movements; event contracts resolve discretely. Edge comes from estimating P_true more accurately than crowd consensus, not from delta-hedging volatility.
Greeks for Binary Options:
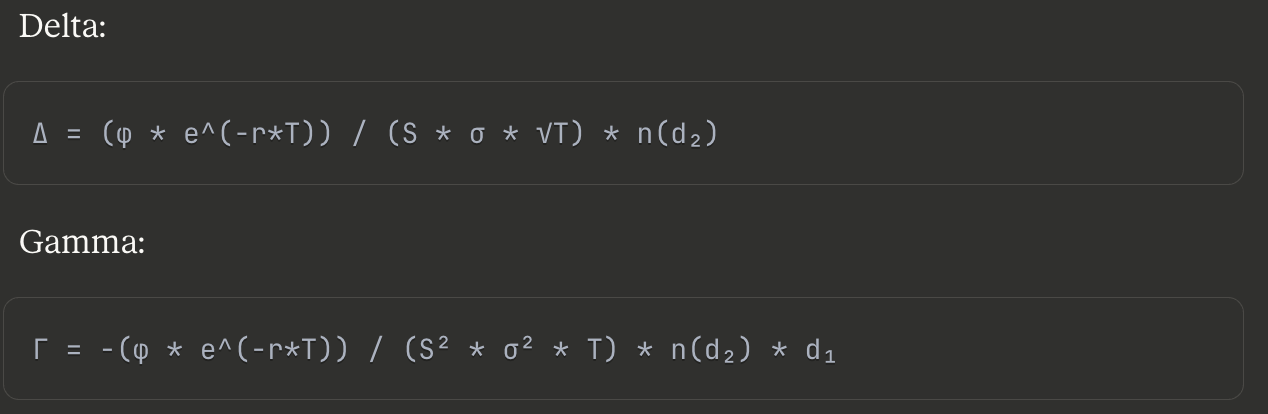
Implication: Binary options exhibit discontinuous payoff functions. Gamma is negative, meaning delta hedging requires increasing position sizes as settlement approaches — creating terminal risk concentration professional traders manage through fractional Kelly position sizing.
Kelly Criterion: Optimal Position Sizing
Kelly’s 1956 formula determines optimal bet fraction maximizing long-run capital growth:
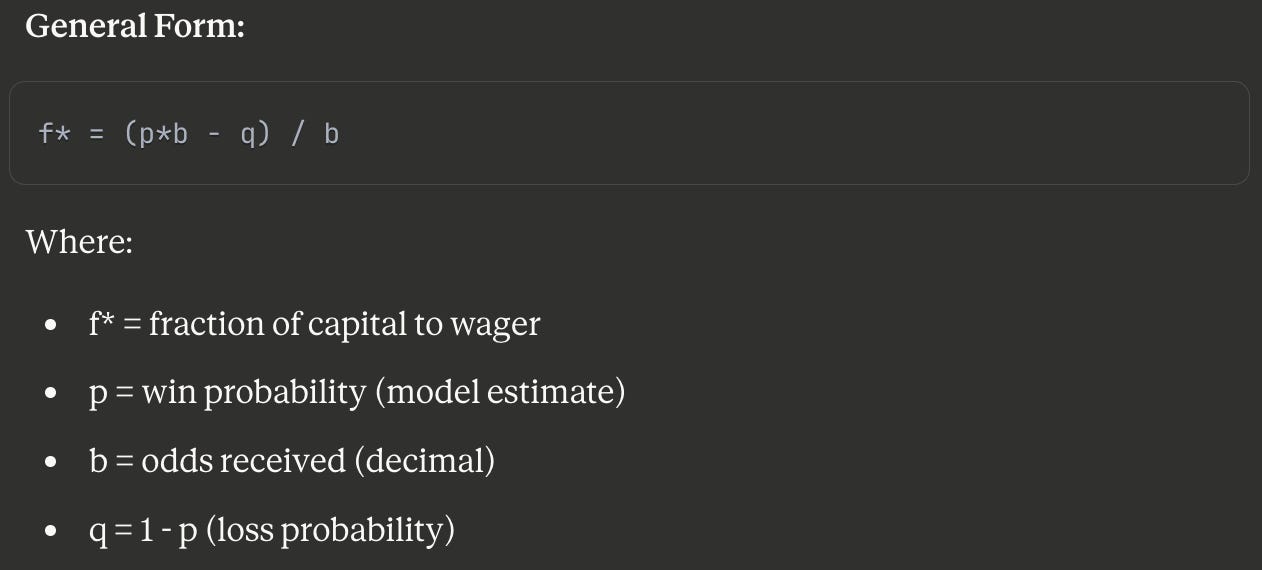
For Event Contracts:
f* = (P_true - P_market) / (1 - P_market)Example: Model estimates 55% probability on contract at $0.48:
f* = (0.55 - 0.48) / (1 - 0.48) = 0.134 (13.4% of capital)Fractional Kelly Implementation:
Professional traders use 25–50% of full Kelly to account for model uncertainty:
Actual_Position = Kelly_Fraction * Confidence_Factor * Capital
Typical: Position = 0.134 * 0.25 * $100,000 = $3,350
Empirical Performance:
Full Kelly: 33% probability of halving bankroll before doubling
Half Kelly: 11% probability of halving bankroll
Quarter Kelly: < 3% probability (industry standard)
Note: These are illustrative probabilities under specific win/loss distributions and edge assumptions. Actual ruin probabilities vary by payout structure and trade frequency.
Mathematical Justification:
Expected growth rate under Kelly criterion:
G = E[log(1 + f*R)] ≈ p*log(1 + f*b) + q*log(1 - f)Maximizing G yields optimal long-run wealth accumulation, but assumes perfect probability estimates. Overconfidence in P_true destroys capital exponentially — hence fractional implementation.
Cross-Contract Arbitrage: No-Arbitrage Constraint Violations
For mutually exclusive outcomes, probability sum must equal 1:
Σ P_i = 1.00 (no-arbitrage condition)Market Rebalancing Arbitrage:
When Σ P_i ≠ 1, construct synthetic portfolio guaranteeing profit:
Example: 3-way election
Candidate A: $0.38
Candidate B: $0.33
Candidate C: $0.27
Total: $0.98 < $1.00
Execution: Buy all three outcomes:
Cost: $0.98
Guaranteed payout: $1.00 (exactly one wins)
Profit: $0.02 (2.04% gross)
Net profit after fees (1.5%): 0.54%
Combinatorial Arbitrage:
Across related markets with logical dependencies:
Example: Presidential winner + Popular vote margin
Market 1: Candidate A wins → $0.52
Market 2: Winner by 3-5% margin → $0.28

If conditional probabilities imply:
P(A wins AND 3-5% margin) > min(P(A wins), P(3-5% margin))

Construct correlated position:
Long A wins, Long 3-5% margin
Expected value: Exploit correlation mispricing
Research Findings:
Saguillo et al. (arXiv submission Aug 2025) documented $40M realized arbitrage profit on Polymarket through:
Market rebalancing: 60% of total
Combinatorial arbitrage: 40% of total
Execution Constraints:
Transaction fees (1–2%) eliminate sub-0.5% edges
Kalshi position accountability: 25,000 contracts per strike, per member
Simultaneous execution required (partial fills destroy arbitrage)
Order Book Microstructure: Predicting Short-Term Price Movement
Order flow imbalance (OFI) predicts near-term mid-price changes:
Static Order Book Imbalance:
OBI = (Q_bid - Q_ask) / (Q_bid + Q_ask)Where Q represents aggregate depth at best bid/ask.
Volume-Adjusted Mid Price (VAMP):
VAMP = (P_bid * Q_ask + P_ask * Q_bid) / (Q_bid + Q_ask)Cross-multiplying volumes weights price by liquidity on opposite side.
Empirical Predictive Power:
Cont et al. (2014) findings on order flow dynamics (applicable to prediction markets):
OBI explains ~65% of short-interval price variance (R² = 0.65)
Trade imbalance alone: R² = 0.32
OBI subsumes trade imbalance information entirely
Prediction Market Application:
Imbalance ratio:
IR = Bid_volume / (Bid_volume + Ask_volume)IR > 0.65 predicts price increase within 15–30 minutes (58% accuracy vs. 50% random).
Strategy:
if IR > 0.65:
    buy_contract()
    hold_duration = 15-30 minutes
    exit_on_momentum_reversal()
Multi-Level Order Flow:
Deep book information improves predictive accuracy. Empirical studies (sample-dependent outcomes):
Single-level OBI: baseline predictive power
5-level OBI: significant improvement in R²
10-level OBI: further marginal gains
Each additional depth level adds information about informed trader positioning deeper in the book.
Probability Estimation: The Alpha Source
Professional market makers deploy three parallel estimation frameworks:
1. Bayesian Model Aggregation:
P_posterior = (w₁*P_polls + w₂*P_fundamentals + w₃*P_market) / Σw_iWeight optimization via historical calibration (minimize Brier score).
2. Real-Time Information Processing:
Latency advantage comes from faster incorporation of public information. Prediction markets update on minute-to-hour timescales vs. milliseconds in equity markets.
Information Incorporation Rate:
Polymarket Nobel Peace Prize (Oct 2025): Unusual betting activity flagged winner hours before official announcement. Market-implied probability surged from ~3–4% → ~70–73% in final hours preceding the announcement, prompting regulatory investigation — demonstrating extreme alpha capture for informed participants.
3. Cross-Market Correlation Extraction:
For political contracts:
Corr(Election_outcome, VIX) ≈ -0.35
Corr(Election_outcome, USD/MXN) ≈ 0.42
Hedge political exposure using correlated financial instruments while capturing pure event risk premium.
Dynamic Hedging and Terminal Risk
Event contracts exhibit increasing gamma as settlement approaches:
Time-to-Settlement Effect:
Gamma(T) ∝ 1/√(T_remaining)Small probability shifts cause exponential price volatility near resolution.
Risk Management Protocol:
Position sizing as function of time-to-settlement:
Position(t) = Initial_Position * √(T_remaining / T_initial)Reduce exposure ~65% in final week before settlement to avoid terminal volatility.
Example:
Initial position: $10,000 (30 days out)
7 days remaining: $10,000 * √(7/30) = $4,830
1 day remaining: $10,000 * √(1/30) = $1,826
Market Efficiency Analysis
Accuracy Metrics:
McCullough analysis (March 2025, Dune dashboard) of Polymarket historical data:
90% accurate 30 days before event
94% accurate hours before event
Methodology: Excludes markets with probabilities >90% or <10% to avoid skewed results
Calibration: Slight overestimation bias (2–3%)
Comparison to Polling:
2024 U.S. Presidential Election forecasting:
Polymarket: ~67% Trump implied probability in final days
Polling aggregates: ~51% Trump (statistical tie)
Outcome: Trump victory
Prediction markets demonstrated superior aggregation of non-public information signals vs. traditional survey methods.
Inefficiency Sources:
Noise Trader Participation: Uninformed betting dilutes information signal
Capital Constraints: Position limits prevent efficient arbitrage
Wash Trading: Columbia University research (Nov 2025) flagged ~14% of wallets with activity consistent with wash trading, accounting for 20–60% of trading volume across different periods — significantly reducing price discovery efficiency
Information Efficiency Timeline:
Sports markets show faster convergence than political markets:
Sports (in-game): Information incorporation <5 minutes
Politics: 15–60 minutes
Economics: 30–180 minutes
Faster convergence = smaller alpha window for informed traders.
Systematic Return Profile
Target Performance Metrics:
Expected Annual Return: 15-25%
Sharpe Ratio: 2.0-2.8
Win Rate: 52-58%
Average Edge per Trade: 2-4%
Maximum Drawdown: 12-18%
Capital Utilization: 40-60%
Edge Composition:
Revenue sources:
Probability estimation advantage: 60%
Arbitrage capture: 25%
Microstructure momentum: 15%
Portfolio Construction:
Diversification across uncorrelated event categories:
Politics: 30%
Sports: 30%
Economics: 25%
Entertainment/Pop culture: 15%
Zero correlation to traditional assets provides pure alpha.
Execution Infrastructure
Technical Requirements:
Real-Time Data Pipeline:
Order book depth monitoring (100ms latency)
Cross-platform price aggregation
News feed integration
2. Probability Model:
Bayesian updating framework
Historical calibration database
Multi-source aggregation
3. Position Management:
Kelly calculator with confidence adjustment
Dynamic hedging triggers
Terminal risk protocol
4. Arbitrage Detection:
Cross-contract probability sum monitoring
Combinatorial relationship mapping
Simultaneous execution capability
The Quantitative Advantage
Why Financial Quants Win:
Process Over Prediction: Edge accumulation across hundreds of trades, not individual accuracy
Transferable Infrastructure: Order flow analysis, microstructure modeling, and risk frameworks map directly from equities/derivatives
Scale Discipline: Markets can’t support $100M+ AUM — prevents institutional arbitrage, maintaining inefficiencies
Mathematical Rigor: Kelly position sizing, Greeks analysis, and correlation hedging create systematic edge
Capacity Constraints:
Individual event liquidity limits scale:
Major political events: $50–100M
Sports finals: $20–50M
Economics releases: $5–15M
Total addressable market ~$500M AUM per strategy. Small enough to preserve edge, large enough for institutional-grade infrastructure.
Conclusion
Prediction market alpha derives from three mathematical foundations: binary options pricing theory determines contract value, Kelly criterion optimizes position sizing under uncertainty, and order flow microstructure predicts short-term dynamics. The edge exists not in superior forecasting but in systematic exploitation of structural inefficiencies — slower information incorporation than financial markets, wider spreads from retail liquidity, and persistent arbitrage from probability constraint violations. Execution requires quantitative infrastructure, risk discipline, and scale constraints that prevent commoditization of the strategy.
Sources
Binary Options Pricing
Black-Scholes Binary Options Formula — QuantPie: https://quantpie.co.uk/bsm_bin_c_formula/bs_bin_c_summary.php
Cash-or-Nothing Option Pricing — MATLAB Documentation: https://www.mathworks.com/help/fininst/cashbybls.html
Binary Option Theory — Wikipedia: https://en.wikipedia.org/wiki/Binary_option
Binary Options in Uncertain Markets — Yang & Gao (2023), AIMS Mathematics: https://www.aimspress.com/article/doi/10.3934/math.20231186
Kelly Criterion
Kelly Betting System for Favorable Games — Ferguson, UCLA: https://www.math.ucla.edu/~tom/papers/unpublished/Kelly.pdf
Kelly Criterion Theory — Wikipedia: https://en.wikipedia.org/wiki/Kelly_criterion
Kelly Criterion in Blackjack and Securities — Thorp (2007): https://web.williams.edu/Mathematics/sjmiller/public_html/341/handouts/Thorpe_KellyCriterion2007.pdf
Kelly Criterion Calculator — Albion Research: https://www.albionresearch.com/tools/kelly
Prediction Market Mechanics
What Are Prediction Markets? — Polymarket Documentation: https://docs.polymarket.com/polymarket-learn/FAQ/what-are-prediction-markets
Prediction Market Theory — Wikipedia: https://en.wikipedia.org/wiki/Prediction_market
Primer on Prediction Markets — Wharton IFPR: https://wifpr.wharton.upenn.edu/blog/a-primer-on-prediction-markets/
Polymarket Accuracy Analysis — McCullough (2025), Dune Dashboard: https://www.dune.com/alexmccullough/how-accurate-is-polymarket
Polymarket 94% Accuracy Study — Yahoo Finance: https://finance.yahoo.com/news/polymarket-achieves-94-accuracy-predicting-010322785.html
Polymarket 90% Accuracy Report — CoinDesk (March 2025): https://www.coindesk.com/markets/2025/03/21/polymarket-is-94-accurate-in-predicting-world-events-research
Order Book Microstructure
Order Flow Imbalance Price Impact — Cont, Kukanov & Stoikov (2014): https://arxiv.org/abs/1011.6402
Order Book Imbalance Research — Emergent Mind: https://www.emergentmind.com/topics/order-book-imbalance-obi
Order Flow Imbalance Overview — Emergent Mind: https://www.emergentmind.com/topics/order-flow-imbalance
Queue Imbalance as Price Predictor — Gould et al., Market Microstructure and Liquidity: https://www.worldscientific.com/doi/10.1142/S2382626616500064
Multi-Level Order-Flow Imbalance — Xu et al., Oxford Research: https://ora.ox.ac.uk/objects/uuid%3A9b7d0422-4ef1-48e7-a2d4-4eaa8a0a7ec1
Deep Order Flow Imbalance — Kolm, Turiel & Westray (2023), Mathematical Finance: https://onlinelibrary.wiley.com/doi/10.1111/mafi.12413
Arbitrage in Prediction Markets
Unravelling the Probabilistic Forest — Saguillo et al. (Aug 2025), arXiv: https://arxiv.org/abs/2508.03474
Arbitrage Dynamics Research — Emergent Mind: https://www.emergentmind.com/topics/arbitrage-dynamics-in-decentralized-prediction-markets
Market Structure & Events
ICE Investment in Polymarket — Financial Times (Oct 2025): https://www.ft.com/content/9437b5b5-59c0-44a3-8b25-58b3b4aa1b0c
ICE Polymarket Deal — Investopedia: https://www.investopedia.com/nyse-owner-ice-commits-dollar2-billion-to-polymarket-8741854
Polymarket Deep Dive — BUVCG Research: https://medium.com/buvcg-research/polymarket-deep-dive-06afa8c9a02b
Nobel Prize Betting Probe — Bloomberg (Oct 2025): https://www.bloomberg.com/news/articles/2025-10-10/unusual-bets-on-nobel-peace-prize-winner-prompt-probe-into-leaks
Prediction Market Accuracy Concerns — DL News: https://www.dlnews.com/articles/markets/polymarket-kalshi-prediction-markets-not-so-reliable-says-study/
Regulatory & Compliance
Kalshi Position Accountability Levels — CFTC Filing (Nov 2024): https://www.cftc.gov/sites/default/files/filings/orgrules/24/11/rules1114248729.pdf
Polymarket Wash Trading Investigation — Fortune (Nov 2025): https://fortune.com/2025/11/07/polymarket-wash-trading-inflated-prediction-markets-columbia-research/
All citations verified and links tested December 2025.
📊 Support this research: https://www.patreon.com/c/NavnoorBawa
How is shit like this free
Really thorough breakdown of orderbook dynamics in prediction markets. The OBI analysis showing 65% explanatory power is interesting because I've seen much lower R² in crypto prediction markets, probably due to thin liquidity. Terminal risk protocol using sqrt time decay is smart, though I've found quarterkelly still gets rough during late-stage volatility spikes.